
Start with the work analysts actually do
A data analyst turns messy business numbers into a decision someone can act on. In 2026 that still starts with spreadsheets, then SQL, then a dashboard — not with a machine-learning course on day one.
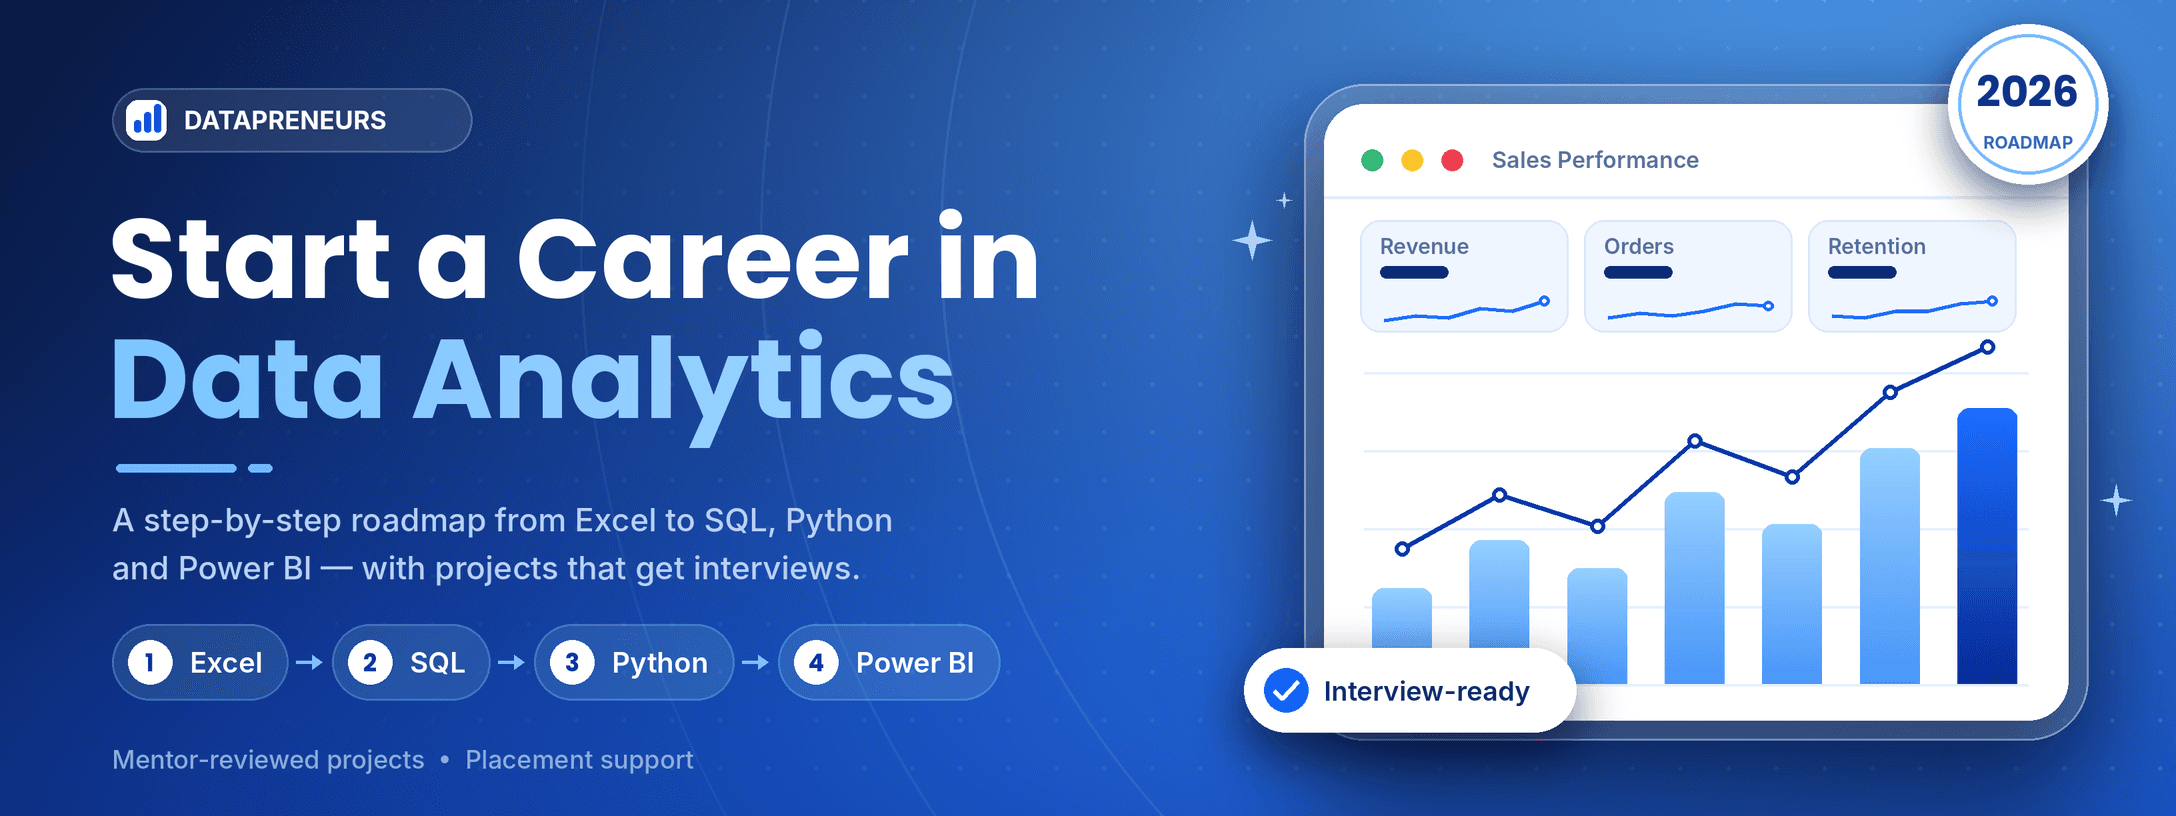
DataPreneurs builds the Data Analytics programme in that order so each tool has a job: Excel for business logic, SQL for real tables, Python for repeatable cleaning, and Power BI for the story you show a hiring manager.
A practical order of skills
Follow the sequence below. Each step should end with a small artefact you can put in a portfolio, not only a certificate.
- Excel and business metrics: pivot tables, lookups, and a one-page summary a manager can read.
- SQL: joins, filters, aggregations, and one window function you can explain out loud.
- Python: pandas for cleaning a messy file and a short notebook that documents your steps.
- Power BI: one dashboard with a clear question, filters, and a written insight.
- Storytelling: what changed, why it matters, and what you would do next.
Projects that get interviews
Recruiters scan for proof you can query data and explain a result. Three projects are enough if they are specific: a sales performance dashboard, a customer cohort in SQL, and a Python cleaning notebook with before-and-after checks.
On the Data Analytics Course, mentors review these projects the way a BI lead would — metrics, charts, and the sentences you would say in a screening call.